
Ecosystem
Measure an innovation economy with figures that survive review
Ecosystem reporting usually rests on numbers nobody can trace. This covers 469,000+ companies and 707,000+ disclosed rounds across 275 countries and territories, and publishes what is missing alongside what is there.
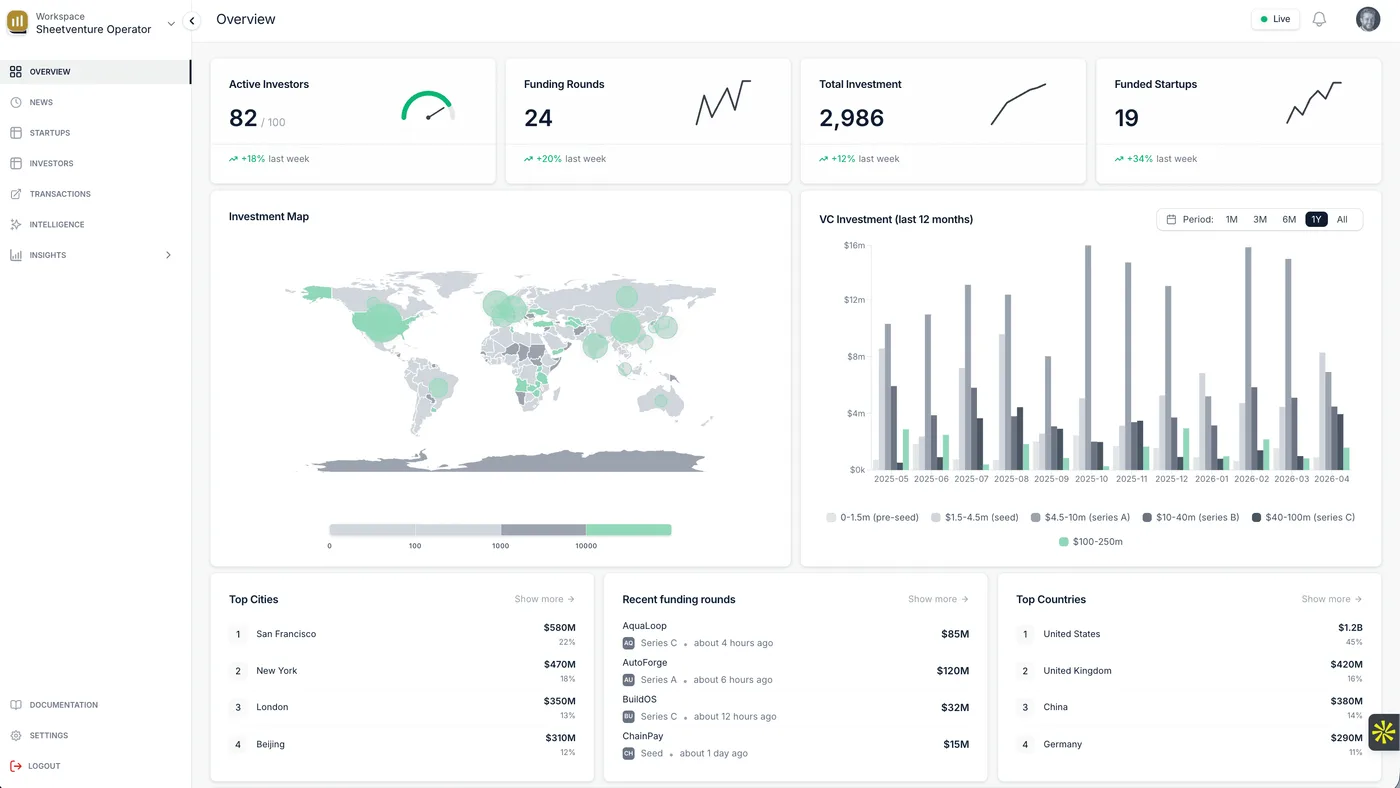
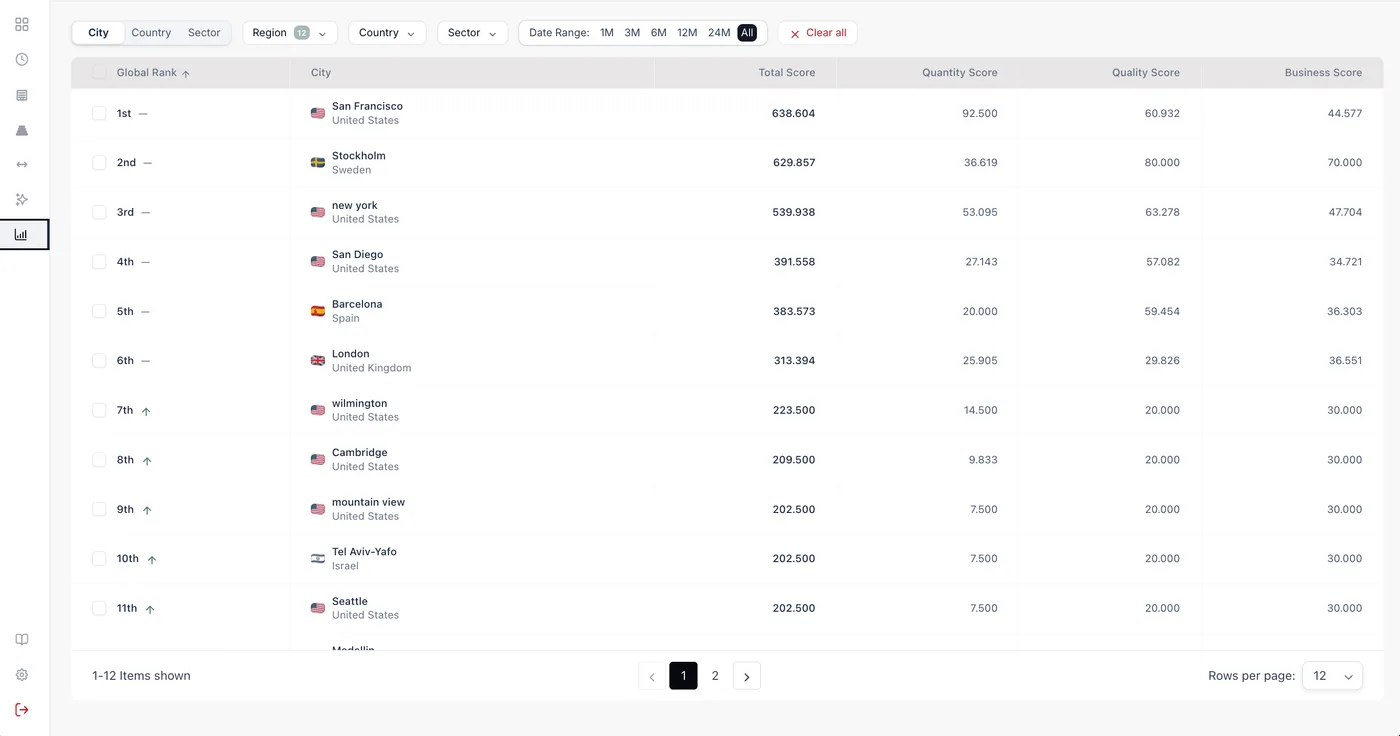

Live coverage
The dataset behind the map
Read from the database when this page is built, so a figure quoted in a report can be checked against the source.
- 0
- Companies
- 0
- Disclosed funding rounds
- 0
- Countries and territories
- 0
- Sectors
What you can answer with it
- Where is capital actually landing Funding volume and velocity by country, region and sector, built from disclosed rounds rather than survey estimates.
- Who is funding this economy Investor concentration and origin — domestic against foreign capital, and which funds return to a region rather than appearing once.
- Is the ecosystem maturing Stage distribution over time shows whether a region is producing later rounds or repeatedly restarting at seed.
Where the rounds we hold actually are
Startups and disclosed rounds by country, scaled against the largest. Country comes from the company record, and it is populated for roughly six in ten companies — so this undercounts rather than estimates, which is the safer error for a published figure.
United States
- Rounds
- 204,478
- Last 12 months
- 10,466
- Startups
- 92,152
100% relative to the largest
Top twelve countries by round count. Countries below 100 rounds are left out; the full distribution is on the coverage page.
Why the methodology matters more than the map
Every definition is stated
Active means a disclosed round in the last 18 months. Disclosed means the amount was public. A figure without its definition cannot be defended in a review, however good the visualisation.
Gaps are published, not smoothed
Where coverage is partial for a country or sector the percentage is on the coverage page. Smoothing over a gap is how an ecosystem report becomes indefensible.
Comparable across regions
The same definitions apply everywhere, so two regions can be compared without adjusting for a different methodology on each side.
Methodology you can put in a published report
Every figure carries its definition: what counts as active, what counts as disclosed, what is missing. That is the difference between a number you can cite in a policy paper and one you cannot.